Decades of research on the topic of crude oil biodegradation revealed that successively increasing levels of alteration recorded amongst the hydrocarbon components in crude oils is often accompanied by the deterioration in physical properties such as viscosity. However, when correlations were attempted on large viscosity and geochemical data sets the final results proved largely disappointing. After all correlations should exist, since biodegradation produces increasingly viscous oils with increasingly altered hydrocarbon compositions! During March 2008, Gushor revolutionized the analytical protocols, from sample collection, shipping, handling and laboratory processing that provides us with the opportunity to acquire highly reproducible and accurate concentration data for individual hydrocarbons. In addition, data generated since March 2008 is consistent with the data that is generated today, paving the way for many applications that require consistent data sets over periods of many years. Today’s geoscientists are benefitting from highly accurate quantitative data that is well inside the 5% errors on a suite of target compounds.
Meanwhile, considering the issues surrounding viscosity measurements, Miller et al. (2006) called for the introduction of standardized procedures such as an ASTM method to qualify the viscosity measurements. Researchers at the University of Calgary, concerned by the errors in viscosity data measured on oil samples recovered from oil sand cores, came up with the idea of literally squeezing oil out of rocks! The plunger was invented which led in 2006 to the birth of Gushor Inc, a service and research company demonstrates the successful transfer of technology out of the University of Calgary and into the corporate world.
Today Gushor Inc. has recognized many of the issues that were contributing errors to the viscosity measurement and has provided numerous solutions which are documented in peer reviewed journals, have been presented at major national and international conferences, and disclosed in several patents. This document serves to provide you with the information to select the best route to the most accurate viscosity data that can be obtained on oils recovered from core samples. Indeed, accurate viscosity data is critical in determining thermal vs. cold production and the costs associated with the wells development plan.
The methods typically employed for the recovery of oil from core samples are based either on chemical extraction or mechanical extraction. Here we present a critique on the methods and also recommend the best practice to truly define the oil properties in your reservoir.
1) Chemical Extraction methods:
a) Froth Flotation (The Clark process)
Froth flotation involves mixing oil sand with water at an elevated temperature (40-60 ºC) in a bubble bath! The combination of elevated temperatures, an open system and bubbling air through the system leads to the recovery of a froth that is enriched in bitumen, but depleted in volatile compounds and also contains water (typically 50%) plus residual solids, all of which are detrimental to the accuracy and precision of the final viscosity measurement.
b) Mineral dissolution and froth flotation (applicable to carbonates)
The potential issues are as above, plus chemical alteration due to the interaction of hydrochloric acid with bitumen components e.g. hydrochloric acid interaction with basic nitrogen compounds form salts rendering their solubility in water, hence the compounds will be removed from the oil.
c) Solvent extraction (Dean & Stark)
Although all of the oil in the core is recovered using solvent extraction, there are significant problems with solvent removal and this is exacerbated with higher viscosity oils:
i. Toluene removal from heavy, viscous oils can be very difficult, requiring up to several hours on a rotary evaporator. Incomplete solvent removal results in lower than true viscosities with as little as a few percent residual solvent changing the viscosity by more than a factor of two (compare data from pre-1985, when mechanical extraction was introduced).
ii. Conversely, completely removing solvent (the boiling point of toluene is 110 ºC) also removes volatile liquid components from the oil resulting in higher than expected viscosity data. The oil sample is damaged! The measured viscosity is higher than the true viscosity.
iii. Due diligence experiments carried out by Gushor showed that there was no inflection or other way to detect when the solvent was more or less completely removed and even after the sample had been damaged and the viscosity had increased beyond the nominal, known value, there was still residual toluene that was detectable in the samples.
Interestingly, a number of researchers highlight the problems of measuring viscosity associated with solvent extraction, whereas the viscosity experts at Gushor have the solutions that have been published in peer a reviewed journal (Jiang et al., 2010).
We are able to recommend chemical extraction methods that work!
- GViscTM – solvent based extrapolation (also see gAPI)
- ProxViscTM – requires a calibration data set built on fresh samples
GviscTM
GViscTM is a solvent hybrid technology whereby the amount of solvent added to a bitumen or heavy oil extract from core is accurately determined. The viscosity of the mixed solvent – heavy oil (or bitumen) is determined with different solvent contents and the resulting viscosity versus solvent content curve is extrapolated to zero solvent content where the viscosity is given. GViscTM may be applied to core samples with low bitumen contents (e.g. transition zones near the base of the water line) and/or cuttings samples.
In Figure 1, where both GViscTM and plunger viscosities were measured on samples representing the oil column, the data are highly comparable. However, plunging the samples from the transition zone yielded only water. The GViscTM technology is able to work with oil lean samples and shows that the viscosity trend continues to increase down through the transition zone. The increasing trend in viscosity is also supported by the changes in hydrocarbon composition (not shown).
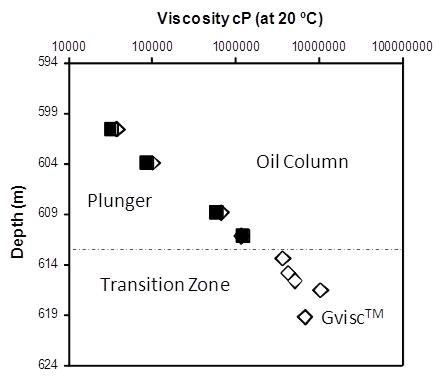
Figure 1. Plot of viscosity obtained by GViscTM and plunger versus depth (m) in a Peace River oil sands well.
ProxViscTM
ProxViscTM is a viscosity prediction method based on correlations established between viscosity and geochemical data that is compiled on fresh core samples. Once the correlations have been established, the geochemical data may be generated on small samples of old stored cores, oil lean cores, cuttings samples and contaminated cores. Figure 2 shows the viscosity profiles obtained from the plunger (measured) and the predicted viscosity using ProxViscTM are closely aligned. Where core samples (or cuttings) are contaminated by drilling mud additives (e.g. base oil), only specific components indigenous to the oil/bitumen are selected for ProxViscTM thereby avoiding the contamination.
In the event that a ProxViscTM model has been established in one well location, fluid property information may be obtained on cuttings samples from vertical and horizontal wells, therefore coring is not always necessary thereby reducing costs for reservoir evaluation.
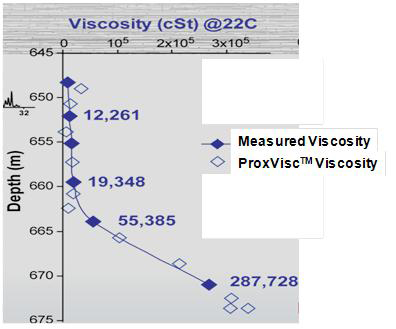
Figure 2. Plot of plunger and ProxViscTM predicted viscosity profiles versus depth (m) in the Peace River Oil Sands.
2) Mechanical extraction methods:
a) Centrifugation (Wallace et al., 1984)
Centrifugation is carried out under a partial vacuum which inevitably promotes the loss of light ends. The variable length of “spin” times according to the viscosity of the oil/bitumen and the grain size distribution of the reservoir rock control the required spin time. The very high pressure extraction system also mobilizes water/oil/solids material into a single collection vessel. Therefore there is inevitably some clean–up required to recover the oil sample. Any laboratory handling promotes the loss of light ends further compromising the resulting viscosity data. Incidentally, in the case that the oil residing in the core is super viscous the oil may remain immobile even after prolonged centrifugation.
Due to these issues we don’t use centrifugation (see Adams et al., 2008).
b) Gushor mechanical extraction (PlungerTM)
The Plunger method was developed in response to the poor correlations observed between viscosity and geochemical data. After all, biodegradation produces increasingly viscous oils with increasingly altered hydrocarbon compositions; therefore correlations should exist between viscosity and hydrocarbon data!
In general, the Plunger leads to the recovery of 10 g bitumen from 200 g of oil sands core (or cuttings) by mechanical displacement without the use of solvent. The recovered oil passes through a filter system leading to oil/bitumen with negligible fines and low water (1-6%) content. The viscosity range of the fluids recovered from plunging range from <1kcP to 10s McP (measured at 20 °C, close to typical reservoir temperatures). The plunger may be deployed at rig site, enabling viscosity measurements to be conducted on core samples retrieved as the core is brought to the surface. The field viscosity logging program allows the recovery of oil from fresh core with the volatile liquid components that are usually lost during shipping and storage. Oil can be recovered and viscosity measured before the petrophysical logging runs are completed.
The Plunger operates under a sealed system allowing the oil sample to be collected in a PVT bottle. In the event that a pressurized core could be loaded into the Plunger, then a live (gas containing) oil may be recovered.
In addition, multiple plunging runs can be made to ultimately collect large volumes of oil for PVT and/or assay analysis. The versatile nature of the Plunger afford the recovery of bitumen from carbonates such as the Grosmont Formation in Alberta and also the Middle East demonstrating that oil may be recovered from rock material.
In the event, that the core samples are obtained from transition zones or oil lean intervals, the produced water may be submitted for water chemistry and stable isotopes analysis to determine the properties of formation water.
Since the introduction of the Plunger, we now see very strong correlations between viscosity and geochemical data (R2 = 0.99) that paves the way for applications such as ProxViscTM. Correlations established between reliable viscosity (Plunger recovered oils) versus accurate hydrocarbon concentration (and fingerprints) data (Fig. 3) contribute to the ultimate viscosity prediction model – ProxViscTM.
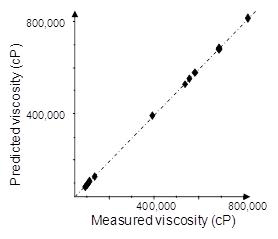
Figure 3. Plot of measured viscosity versus predicted viscosity based on Partial Least Squares treatment of the hydrocarbon concentration data and viscosity.
3) Plunger versus centrifugation
Due to the errors associated with viscosity data an alternative extraction method had to be found to test the efficacy of centrifugation. The Plunger method was launched in 2006 with impressive results. The issues surrounding viscosity measurements on oils recovered from core samples and the solutions have been documented in Adams et al. (2008).
Figure 4 shows the hydrocarbon data obtained during solvent extraction, centrifugation (spun oil) and Plunger recovery of oil from core samples. The compositions are very consistent between the methods indicating the lack of fractionation amongst the aromatic hydrocarbon compounds using the different recovery systems.

Figure 4. Partial reconstructed mass chromatograms representing C1-C5 alkylnaphthalenes and C0-C1-alkyldibenzothiophenes (m/z 142, 156, 170, 184 and 198) and C0-C2-alkylphenanthrenes (m/z 178, 192 and 206) following GC-MS analysis of total hydrocarbon fractions isolated from solvent extract, spun oil and plunged oil.
The composition of the medium volatile compounds appears to show no difference between the centrifuged oils versus the plunged oils (Fig. 4); however we have observed a significant discrepancy between the viscosities of the recovered oils. In Table 1, the viscosity data are compared between the centrifuged oils versus the plunged oils. The core samples were selected and the oils recovered from the core using centrifugation and plunger at the same time, such that the viscosity data were obtained within 48 hours i.e. a direct comparison. In all cases the viscosity of the centrifuged oils were higher than the Plunger recovered oils, perhaps reflecting the higher water content and solids material in the centrifuged oil, while loss of volatile liquid components e.g. alkylmethylcyclohexanes (Fig. 5) is promoted under the conditions of a partial vacuum in the centrifuge contributing to increased viscosities.
Table 1. Dead oil viscosity data, water content (wt%) determined by Karl Fischer (KF) analysis and sediment fines content (wt% by ASTM D-473) for the oils recovered from Peace River oils sands cores by mechanical extraction using the plunger and centrifugation methods.

Viscosity difference between plunged and centrifuged oils indicated in parentheses with viscosity measurements at 20 °C; n.m. = not measured (due to lack of oil recovery). * = measured at 25.5 °C.

Figure 5. Partial reconstructed m/z 97 mass chromatograms following GC-MS analysis of oils recovered by centrifugation (spun) and plunger processing.
One of the concerns that has often been raised by researchers and plunger skeptics is “Does the Plunger recovery cause fractionation of the oil?” The Plunger configuration has allowed us to test the potential influence of fractionation as a function of oil production since we are able to collect aliquots of oil as the Plunger process is in progress. It is not clear that this test has ever been investigated during the centrifuge process. Figure 6 shows the viscosity data for a suite of oil samples collected as separate aliquots during plunging. The viscosity data are consistent from the 1st aliquot through to the 6th aliquot. In addition, the viscosity falls close to the original measured data and the viscosity of the average of the summed aliquots. Furthermore, Gushor Inc. has carried out experiments to demonstrate that the residual core sample after the plunging process has been complete is chemically identical (by GC-MS and SARA analysis) to the oil that was recovered.

Figure 6. Plot showing the viscosity associated with produced oils collected from the plunger as a function of time, compared to the viscosity of the original full volume collected sample and the average from the sum of the aliquots.
4) Viscosity bullet points
Controls on dead oil viscosity measurement from core:
- Storage and handling of core/oil
- Oil extraction method (spin or plunge or solvent)
- “Contamination” of the extracted oil with water and rock matrix material (increase viscosity by factor of 2 to 3)
- Machine error + Type of viscometer + Technician measurement error + non-Newtonian fluid effects (±20% error)
- Extrapolation of measured intermediate temperature (e.g. 40-50-60 ºC) viscosity data to reservoir temperatures (e.g. 20 ºC) has been known to underestimate bitumen viscosity by up to an order of magnitude.
Representative samples require consistent sample handling & viscosity measurement! We have met the challenges and to date we continue to provide the oil industry with the most accurate viscosity data available. In addition, the Plunger recovered oils provide viscosities that are comparable to produced oil viscosities, indicating that Plunger recovered oils provide the ultimate guide to indicate the likely recovery strategy i.e. when risking cold versus thermal production
If you have any questions or wish to discuss further please contact Gushor at info@gushor.com or (403) 457-4874.
Author: Dr. Barry Bennett – Director of Geoscience Technology – Gushor Inc.
